
Update Nov 2022:
This blog has now been superseded by new data up to 2021
which are available here
In this blog I report on growth in MDPI journals from 2015-2020. It updates two previous blogs on the same topic (the most recent is here). It provides the necessary background for forthcoming results of a survey of over 1000 researchers about MDPI journals. The data used in this report are freely available here, and see the ‘methods’ at the end of this report.
The summary is that MDPI’s growth continues to be extraordinary. Following Paolo Crosetto’s recent work, I have revised arguments about the tensions that this growth brings between growing revenues and maintaining standards that are now clearer than in previous years. It provides useful background to a survey of 1k researchers and their experience of MDPI which is available here.
1. Growth, Growth, Growth
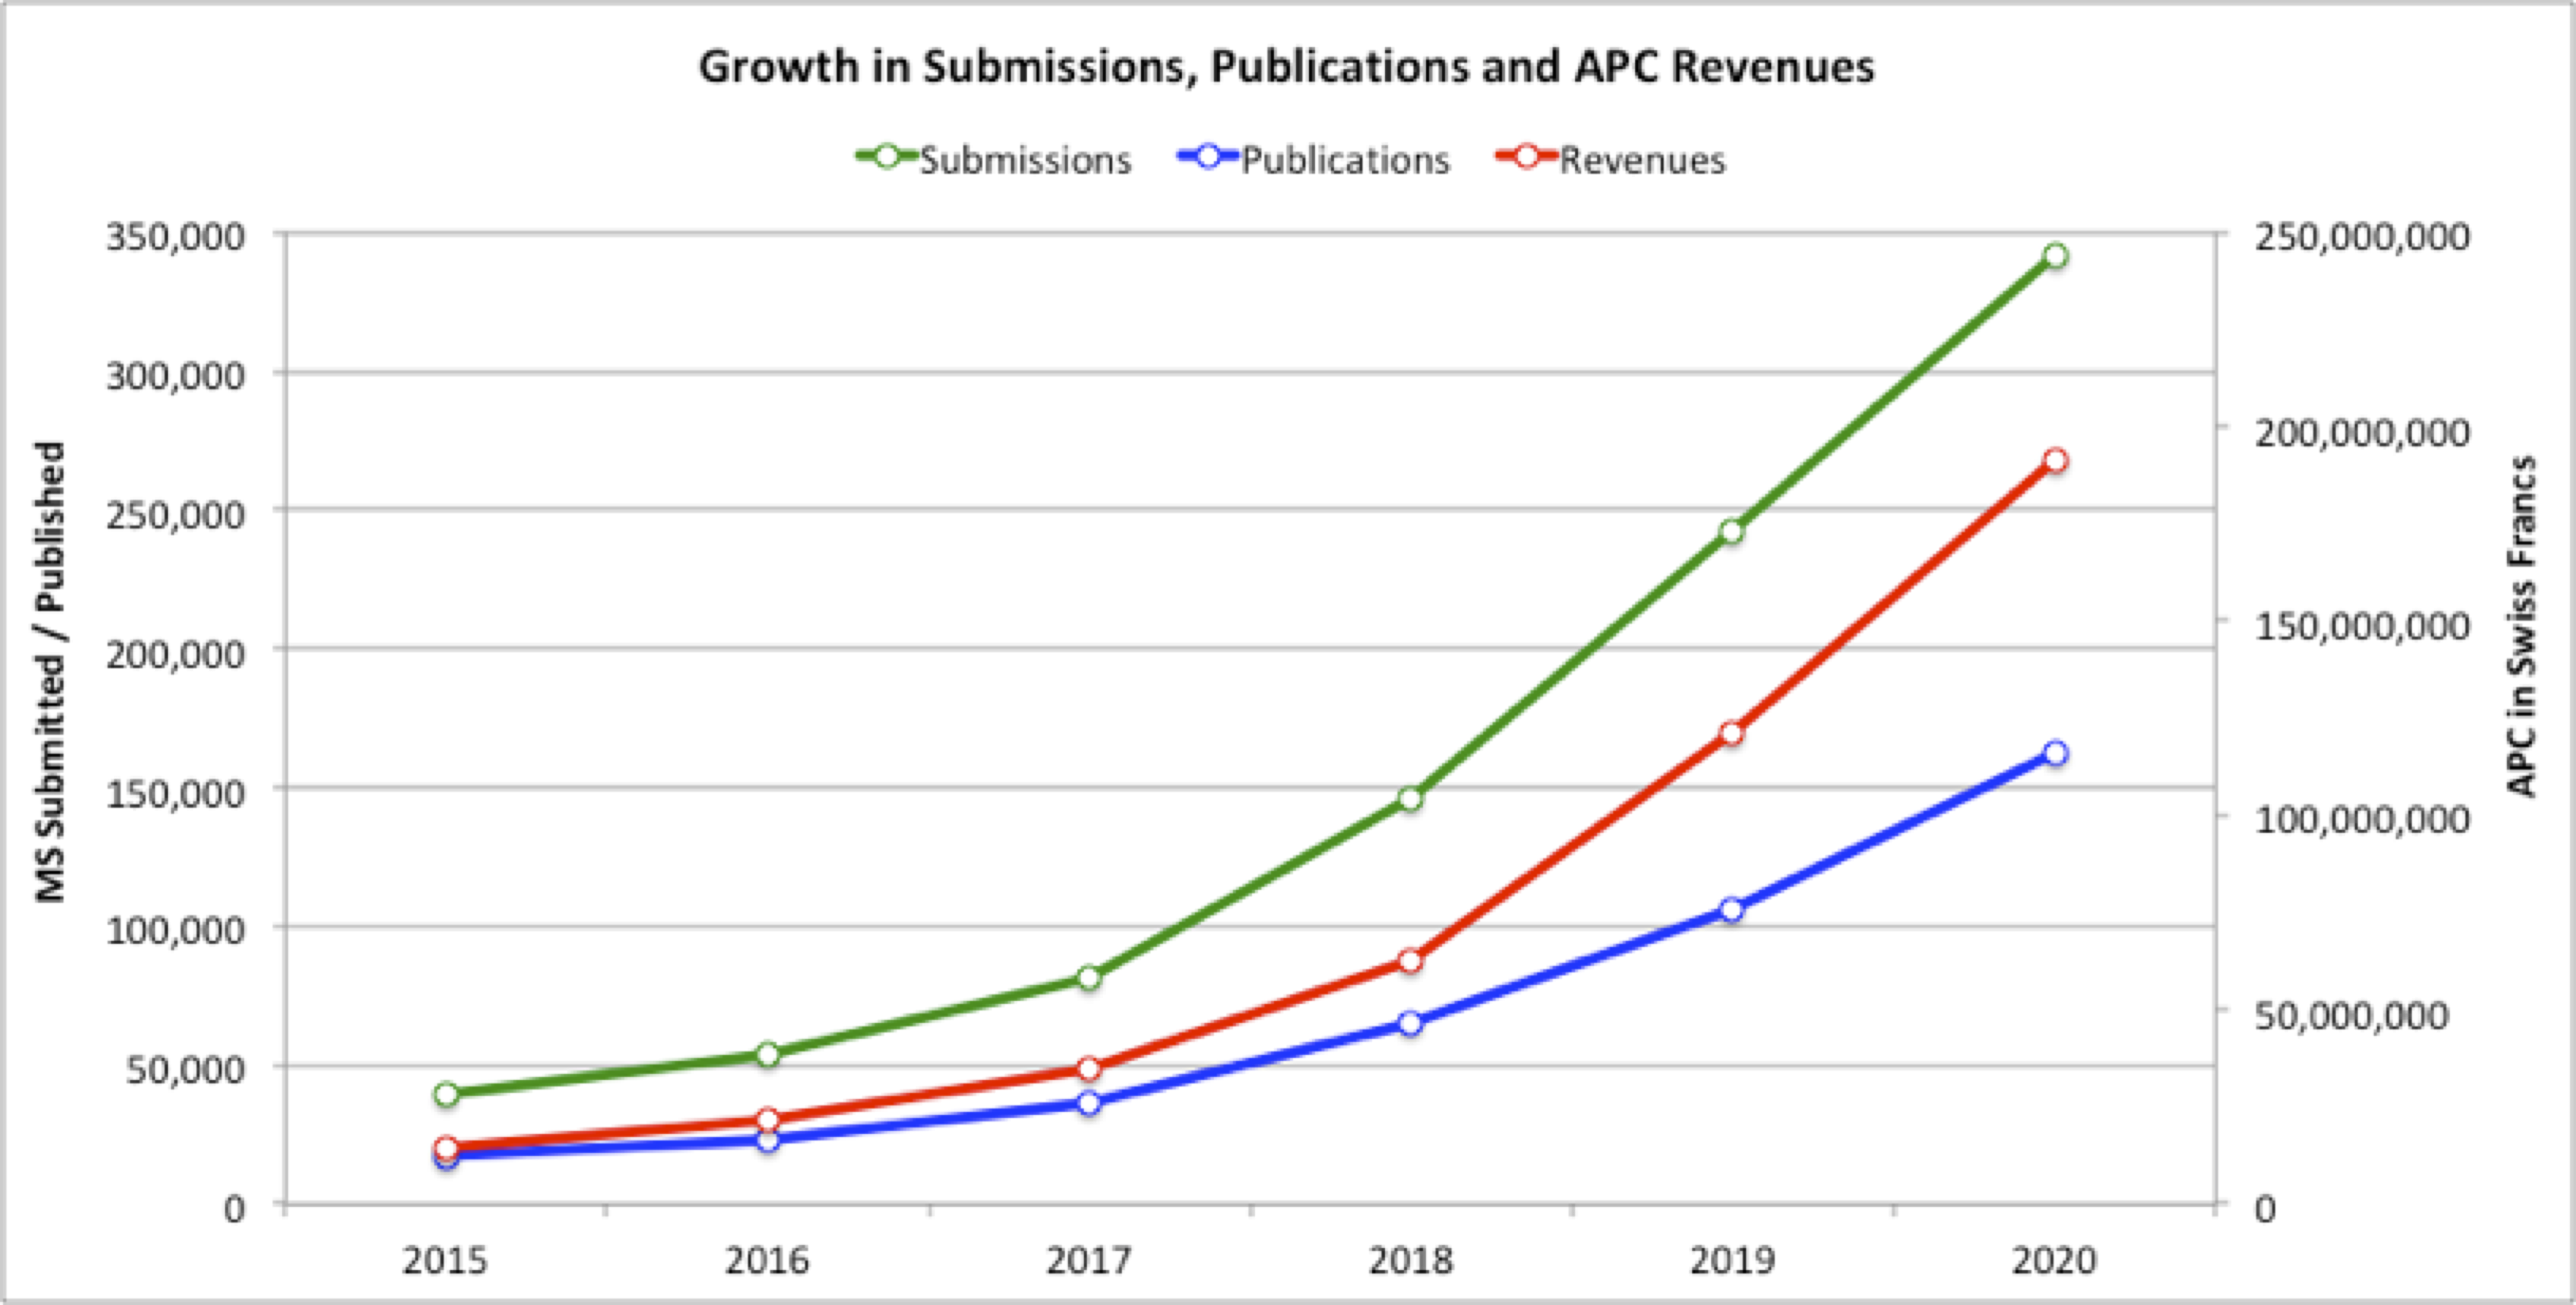
MDPI is interesting because of its sustained expansion rates. All the measures in Table 1 are around ten times bigger than they were in 2015. In 2020 the journals I have included received nearly 350,000 manuscripts, published over 160,000 papers, and earned Author Processing Charges (APC) revenues of nearly 200 million Swiss francs (Table 1; Figure 1).
Table 1: Growth in Submissions, Publications and APC Revenues of leading journals
| Year | Sub’ns | Pub’ns | Revenues (CHF) | Journals | Ann. Rev. Increase |
| 2015 | 39,125 | 17,379 | 14,424,570 | 148 | |
| 2016 | 54,032 | 23,529 | 21,552,564 | 155 | 49% |
| 2017 | 81,844 | 36,675 | 34,694,550 | 176 | 61% |
| 2018 | 146,118 | 65,163 | 62,556,480 | 176 | 80% |
| 2019 | 241,991 | 105,936 | 121,190,784 | 176 | 94% |
| 2020 | 342,025 | 162,319 | 191,536,420 | 176 | 58% |
Revenues are calculated from average APC recovered per paper (see methods). They do not account for inflation
Figure 1: Submissions, Publications and APC Revenue 2015-2020
2015, N = 148; 2016, N = 155; 2017, N = 176.
2. Rejection Rates Have Not Changed
The growth, and revenues, have not been achieved by lowering rejection rates. The journals with the lowest rejection rates have continued to count for only a small minority of publications and fees (Table 2 and Table 3).
This fact is important because observers sometimes claim that MDPI is a predatory press. I understand predation to mean a form of vanity publishing, in which researchers can, effectively, pay to get anything published because very little is rejected. I cannot see how this is claim can be sustained for MDPI journals as a whole. Around 30% of MDPI journals have rejection rates of below 40% (Table 4), and these consistently account for less than 20% of revenues and published papers. Higher rejection rate journals account for the majority of publications and revenues.
Table 2: Papers Published in Different Rejection Rate Categories
| Rej Rate (%) | 2015 | 2016 | 2017 | 2018 | 2019 | 2020 | Total |
| <40 | 2,533 | 2,962 | 5,497 | 11,101 | 10,257 | 28,507 | 60,857 |
| 40-49 | 1,560 | 5,320 | 8,423 | 11,304 | 19,350 | 34,379 | 80,336 |
| 50-59 | 8,679 | 8,228 | 14,063 | 22,078 | 46,349 | 75,961 | 175,358 |
| >=60 | 4,607 | 7,019 | 8,692 | 20,680 | 29,980 | 23,472 | 94,450 |
| Total | 17,379 | 23,529 | 36,675 | 65,163 | 105,936 | 162,319 | 411,001 |
Table 3: Estimated APC from Different Rejection Rate Categories (000s)
| Rej Rate (%) | 2015 | 2016 | 2017 | 2018 | 2019 | 2020 | Total |
| <40 | 2,102 | 2,713 | 5,200 | 10,657 | 11,734 | 33,638 | 66,045 |
| 40-49 | 1,295 | 4,873 | 7,968 | 10,852 | 22,136 | 40,567 | 87,692 |
| 50-59 | 7,204 | 7,537 | 13,304 | 21,195 | 53,023 | 89,634 | 191,896 |
| >=60 | 3,824 | 6,429 | 8,223 | 19,853 | 34,297 | 27,697 | 100,323 |
| Total | 14,425 | 21,553 | 34,695 | 62,556 | 121,191 | 191,536 | 445,955 |
Table 4: Number of Journals in Different Rejection Rate Categories
| Rej Rate | 2015 | 2016 | 2017 | 2018 | 2019 | 2020 | Total |
| <40 | 44 | 56 | 65 | 69 | 55 | 60 | 349 |
| 40-49 | 26 | 31 | 48 | 33 | 37 | 42 | 218 |
| 50-59 | 45 | 26 | 26 | 33 | 47 | 43 | 220 |
| >=60 | 33 | 41 | 37 | 41 | 37 | 31 | 220 |
| Total | 148 | 154 | 176 | 176 | 176 | 176 | 1,007 |
Note: All these table assume genuine rejection and no ‘churning’ of articles. Ie if an article is rejected it is not then modified and then re-submitted.
3. Growth Begets Growth
Figure 2 shows publications in 2019 against 2020. The red dotted line indicates static output, the black dotted line a doubling of output. Note the logarithmic scale.
As in 2019, the growth in 2020 was driven by large journals becoming more popular – all the blue dots in the top right quadrant are comfortably above the red line. Greatest growth given a journal’s size is found in the middle range journals which publish between 100 and 1000 papers per year. Declines (blue dots below the red line) occur in the smaller journals (bottom left hand side of the graph). Far more journals are expanding than contracting.
Figure 2: Change in Publications 2019-2020 for each journal

The dotted red line represents no change 19-20. The dotted black line represents publications doubling 19-20.
4. Joining the Mainstream
In 2020 as in 2019 MDPI journals are becoming more mainstream. 152 are now covered by the Web of Science (up from 85 in 2016), 163 by Scopus (up from 60 in 2016) and 80 by SCIE (up from 27 in 2016).
5. A Growing Global Reach
Increasing numbers of researchers globally seek to publish in MDPI journals. All regions display a dramatic increase in authors over a 5 year period, generally quintupling in each case. But the most remarkable growth, in relative and absolute terms, has been in Europe where there has been a tenfold increase in authors to over 100,000 in 2020.
Table 5: Authors by Region of their Institution in MDPI Journals
| Region | 2016 | 2017 | 2018 | 2019 | 2020 |
| Australasia Pacific | 1,077 | 1,629 | 2,747 | 3,914 | 5,852 |
| Central Asia | 197 | 492 | 1,128 | 2,518 | 5,309 |
| Eastern Asia | 13,432 | 20,982 | 39,323 | 65,128 | 77,389 |
| Europe | 9,744 | 15,906 | 29,988 | 56,346 | 103,155 |
| Latin Am. & Carib | 918 | 1,728 | 3,174 | 5,441 | 8,701 |
| MENA | 756 | 1,112 | 2,111 | 4,279 | 8,060 |
| North America | 5,112 | 7,606 | 12,156 | 17,657 | 25,975 |
| South Asia | 412 | 685 | 1,306 | 2,487 | 3,462 |
| South East Asia | 623 | 980 | 1,754 | 3,131 | 5,618 |
| Sub-Saharan Africa | 372 | 608 | 865 | 1,386 | 2,516 |
| Grand Total | 32,643 | 51,728 | 94,552 | 162,287 | 246,037 |
Source: Country level data provided by MDPI
The focus on the Global North is even clearer if we consider the distribution of MDPI editorial board members in its leading journals. This is not a particularly exclusive club as the top journals average over 1000 board members each. Stephen Bell’s work shows that these are mainly from Europe and the USA, with over half coming from Italy, the USA, UK and Spain.
Figure 3: Editorial Board Member Geography

Source: Stephen Bell, https://twitter.com/1smbell/status/1299037227889102848
6. A Hungry Publisher
The trends I have summarised above fuel an unease in research communities that this growth is too quick, and that MDPI’s standards are lax. Some observers dismiss MDPI as a predatory publisher, taking fees but not scrutinising work carefully enough. In my previous blog I discussed those claims and complaints at some length. At the same time others insist that their experience has been good, and that problems are specific to some journals and not systematic across the company. They welcome the alternative that MDPI offers from mainstream publishers that are slow, occupied by disciplinary gatekeepers and which are often plainly profit-seekers themselves.
The available data on the review process are ambivalent. Table 6 shows that reviews per publication have declined slightly since 2016, indicating less review and scrutiny of published papers. However reviews per submission have also declined, indicating more desk rejections, and either lower quality submissions and/or higher scrutiny of submissions before review.
Table 6: Trends in Review Reports
| Year | Sub’ns | Papers | Review Reports | Reviews per Pub’n | Reviews per Sub’n |
| 2016 | 58,575 | 23,568 | 128,805 | 5.5 | 2.2 |
| 2017 | 82,100 | 35,900 | 171,700 | 4.8 | 2.1 |
| 2018 | 165,500 | 67,300 | 337,300 | 5.0 | 2.0 |
| 2019 | 269,100 | 106,200 | 451,900 | 4.3 | 1.7 |
| 2020 | 381,100 | 165,200 | 610,300 | 3.7 | 1.6 |
Source: MDPI Annual Reports
In some respects my position remains unchanged from that which I first published in 2019. I see MDPI as presenting a mixed bag of good quality and haste. Its journals are many and varied. But, on the other hand, this variety is governed by a single company’s policies and practices. The incentives, rewards and targets for different journals’ support staff are likely to be similar. It is therefore important to look not just at the variety, but also the commonalities at work.
This points to two concerning trends that have emerged from recent work by Paolo Crosetto.
1. The growth of Special Issues. As I explained in my first blog, Special Issues are a key vehicle for MDPI’s growth. Special Issues draw upon academic networks, making author recruitment and paper reviewing easier and faster. I had not anticipated, however, how extraordinary the growth in Special Issues would be in MDPI journals. Paolo shows that a great deal of the growth in the largest journals is due to the phenomenal increase in their special issues. This is clearly visible in the number of Special Issues released (8.7 per day in the case of Sustainability (!) (Figure 4). It is also plain in the number of papers which Special Issues recruit, relative to standard non-special issue papers. Without Special Issues these journals would be producing far fewer papers. Special Issues underpins the growth of the journals which I have described above.
Figure 4: MDPI Special Issue Growth and Processing Time

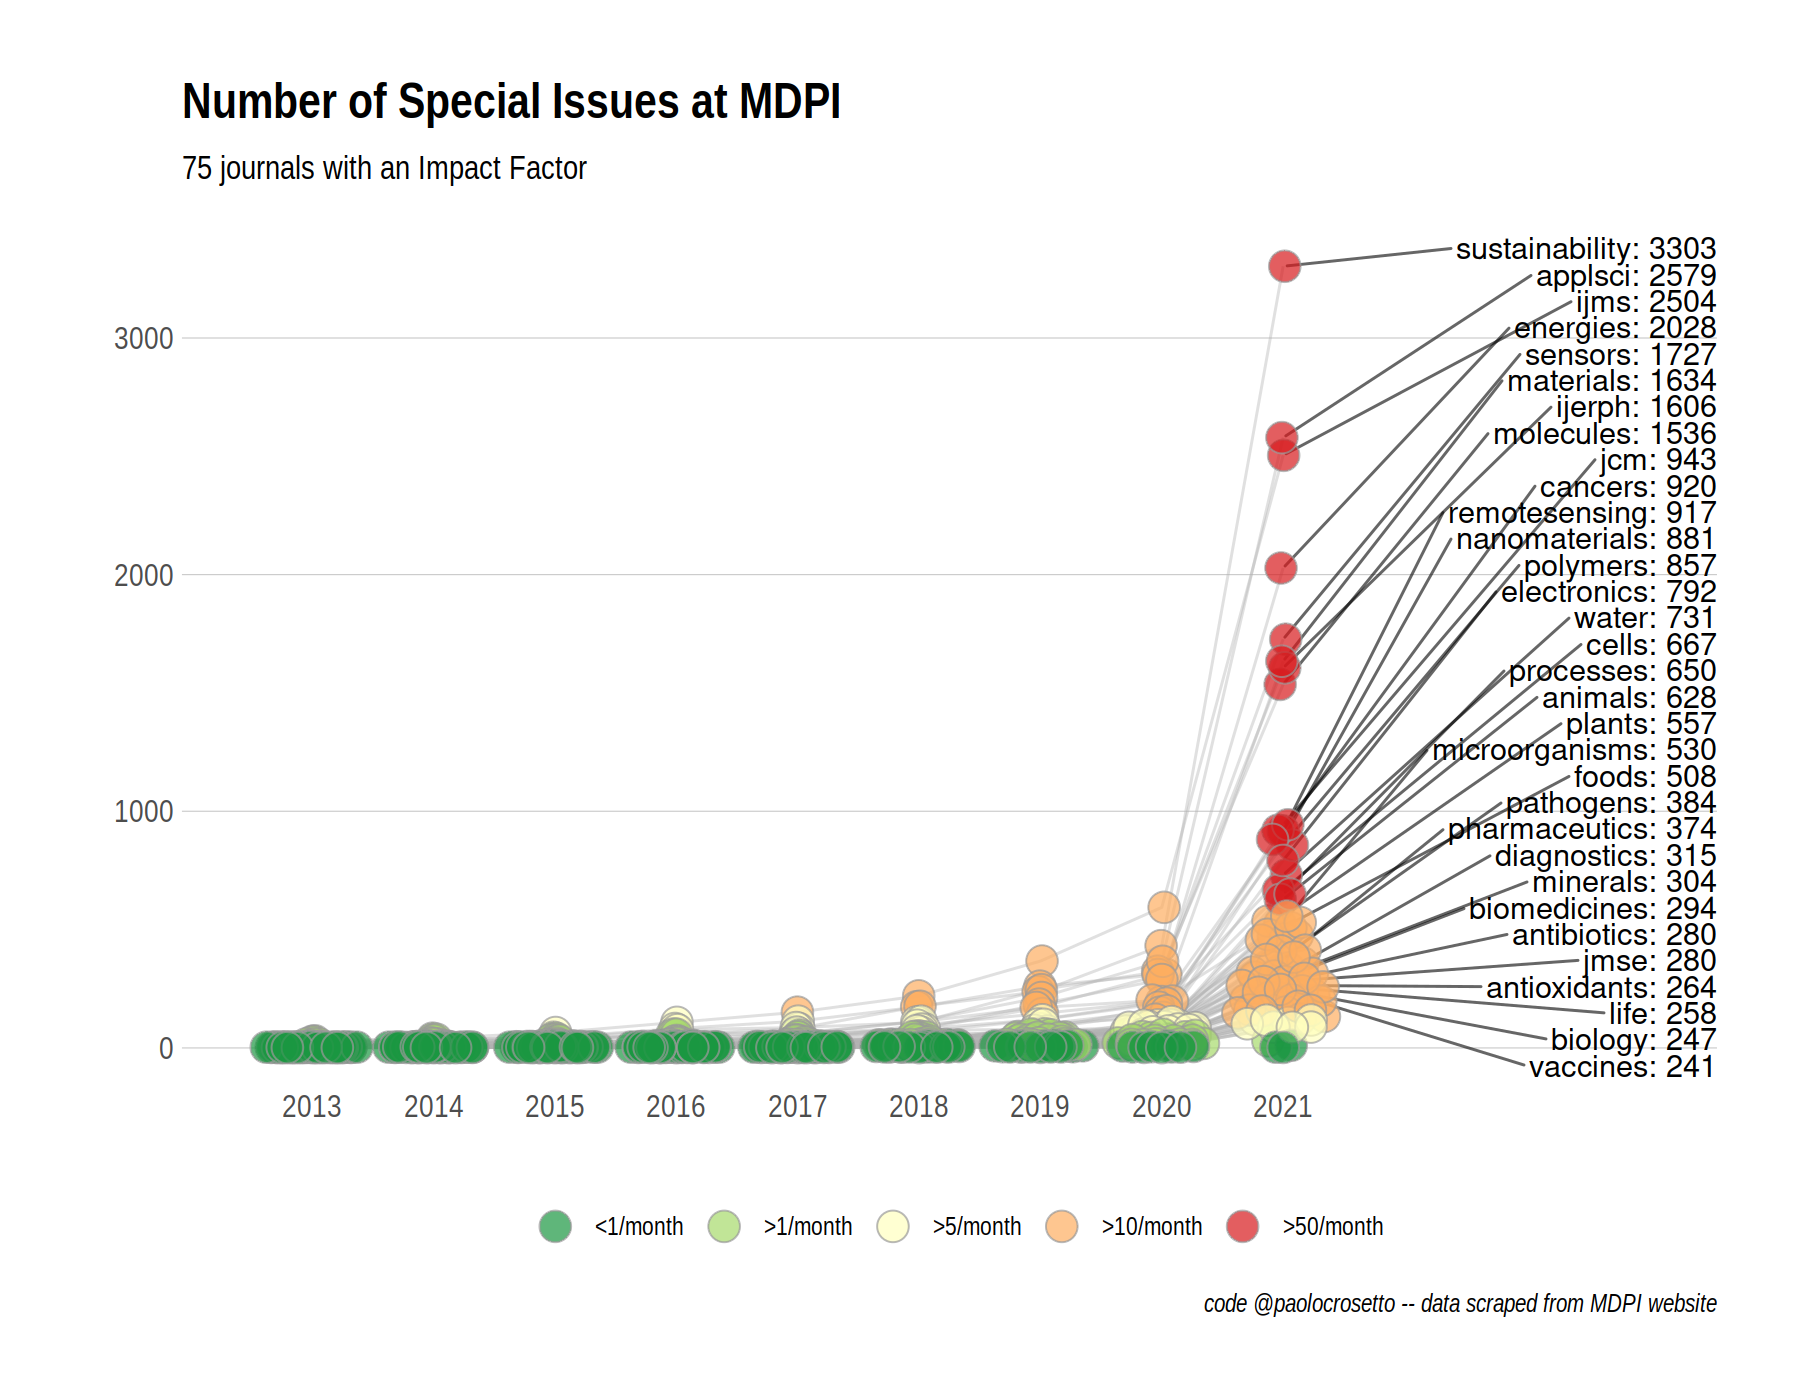
Source: Paolo Crosetto, https://paolocrosetto.wordpress.com/2021/04/12/is-mdpi-a-predatory-publisher/.
2. The decline in paper processing time. Paolo’s work also makes clear that the time from paper submission to publication is becoming increasingly concentrated, and shorter (Figure 5). This is one of the things that the company is proud of – it highlights faster processing time in its annual reports.
I cannot see how these trends results from a concern for quality. A vast increase in papers makes more mistakes morel likely, especially as their scrutiny and revision gets faster. Haste may not necessarily lead to mistakes, but it makes them more likely. There are, however, obvious commercial reasons to speed up, and bulk up the papers, the review process. If 10,000 publishable papers are submitted every month then, over a two year period, the company will earn revenues over 140 million Swiss francs from these papers if it takes 12 months to process them for publication (review, revise, copy edit etc). Only those submitted in year one will begin earning revenues in year two. But if these same papers are published within 40 days of submission then the returns come in much faster. Over a two year period it would earn over 250 million Swiss francs. Faster processing time produces more lucrative returns. Paolo argues that MDPI’s growth is best understood as aggressive rent extraction from journal reputations. MDPI is not a predatory press, as I understand the term. But it is certainly a hungry one.
Figure 5: Changing MS Processing Times

Source: Paolo Crosetto, https://paolocrosetto.wordpress.com/2021/04/12/is-mdpi-a-predatory-publisher/.
Discussion
MDPI presents a conundrum. The success of MDPI journals cannot be explained by lax standards. They have grown because submissions to them have grown. They offer a fast service, and relatively cheap, open access publication. Their reputation, as measured in citation data and listings on indices, continues to grow. There is an increasingly global community of researchers that wants to publish with them. But that growth has not shaken off the unease that accompanies these journals. If anything the anxieties may well have increased because this growth entails practices which can make mistakes easier. The financial reasons for these practices are more obvious than their academic merits. It is not clear how quality is maintained, or standards increased, as publications have accelerated while processing times have decreased.
Or, to put this point differently, it is mistaken to tell one story about the MDPI. Some journals have good reputations. This may be because they are not expanding dramatically. Of 148 journals for which data are available, 95 have consistently published less than 200 papers a year since 2015 (averaging only 75 per year).
But if it mistaken to tell only one story about MDPI journals, it would also be brave to tell more than two. The strenuous efforts of some journals’ editors and staff to do good rigorous work is one story, but the dominant, and most prominent, tale is of growth. 94 of 176 journals for which data are available increased the number of papers they published by at least 25% in 2020. These accounted for over 90% of the estimated APC of the 176 journals – and over 170 million Swiss francs. Growth is the story that MDPI journals like to tell about themselves. It is a clear theme in the company’s annual reports.
In my previous blogs I have argued that we have to understood why MDPI works so well for those who choose to publish with them. I differed from critics of MDPI because I did not ask ‘this is wrong, how can it happen?’, but instead ‘this is happening, for whom does it work?’. However that latter question makes it hard to spot emerging tensions and contradictions. These are now more prominent and I must amend two views I expressed in my initial blog about MDPI’s success.
First, I suggested that weak papers that got through the review process would get buried under the mass of content. The consequences of mistakes for the brand as a whole were low. But that is fails to recognise that the existence of a poor paper is only part of the problem. There are also the collective memories among authors, editors and reviewers of the processes that produced it. If production proliferates, so too can accounts of problems. Even if they are, in relative or absolute terms, few, they can become the story that over-shadows the achievements of the brand.
Second, I mistook the importance of prestige in academic journals. I argued two years ago that MDPI does not seek prestige by rationing space. It wants significance and importance to be determined by the use researchers make of its papers. Uptake was the ultimate measure of significance. However perceived prestige still matters for uptake. Given the abundance of reading material confronting researchers, we tend to put up filters that block out some work, and promote others. Hence we will simply not read large swathes of material that do not appear to be from reputable sources, and we will go out of our way to find work from good authors, and to track the latest publications from the top journals of our field. This means that even good material appearing in poor quality outlets will be ignored, whereas poor paper from the best journals will be heavily scrutinised, even (as is the case in my field) when dreadful rubbish is repeatedly turned out by the best journals. The prestige game cannot be avoided. The danger to MDPI’s brand is that if some journals chose to maximise revenues, then even those which are publishing more slowly will be tarnished. The low prestige of some journals may leak across to others.
There have been claims that MDPI journals are weak and hasty for several years, even when reviewing times were slower, and Special Issues fewer. I discussed them in depth in my second blog. These concerns have not impeded the growth of MDPI’s journals so far. Indeed MDPI has probably grown because of the rapid, convenient service it offers and multiple Special Issues, not despite these. Furthermore MDPI’s own survey work into authors’ satisfaction with their work, shows a positive company, in excellent health (Figure 6). If these data are reliable then MDPI is already locked into a virtuous circle of growth that will see ever more researchers seeking to publish in its apparently space, and ever more reviewers keen to earn the APC reductions their labour affords. This is Volker Beckmann’s argument in his comment on Paolo Crosetto’s blog.
Figure 6: Author and Reviewer Satisfaction

Source: MDPI Annual Report for 2020 page 22. Methods and Sample Size are not reported in that publication.
But if the concerns I have mentioned have not had a visible impact on growth so far, they may do so in the future. Crosetto argues that MDPI’s growth may be unsustainable because of the demands it will place on research communities. Review reports, for example, have increased from 91.5k in 2015 to 610.3k in 2020 (Table 6). And behind that growth is hidden a plethora of email traffic. Submitted papers generate multiple review requests. Quick review and revision entails frequent reminders of reviewers and authors. All this creates incentives for a proliferation of emails which will not be welcome by researchers suspicious of MDPI’s brand. If there is a group of people who are choosing not to engage with MDPI (and Figure 6 can tell us nothing about those people), then they are likely to become more exasperated, and more vocal as MDPI requests increase. Past successes may even create the conditions for future problems.
In order to understand these tensions we need better data on what different communities of researchers think about MDPI journals and their processes. We need to understand the extent to which those views reflect personal experiences, and to what extent they reflect shared stories. We need to understand how these perceptions vary according to discipline, career stage, geography and institution. Some of this information will be available in the short survey of MDPI experience I launched earlier this month. Its findings will be the subject of a companion blog.
Dan Brockington,
Glossop,
16th April 2021
Methods
I copied data for submissions and publications for 176 journals from the MDPI website that began business on or before 2015 and which handled more than 10 papers in their first year. MDPI makes publication data available for four previous years, and only when four years of data are available. The number of journals included is lower in 2015 as data were not, and are not, available for those journals. Data I used in my analysis are available <here>.
Average net APC are based on figures provided by MDPI that have been put in the public domain. They are lower than APC charged because they are net of all waivers exercised. The figures I have used, in Swiss Francs, are:
2015: 830
2016: 916
2017: 946
2018: 960
2019: 1144
2020: 1180
I requested data on authors’ institutions’ countries from the MDPI and am grateful to the company for sharing them. My thanks to Stephen Bell and Paolo Crosetto for sharing their data and analyses with me and for permission to reproduce the figures above.

Pingback: An Open Letter to MDPI publishing | Dan Brockington
Pingback: MDPI Journals – 2015 to 2019 | Dan Brockington
Pingback: A Checklist of Questions for Working with Open Access Journals | Dan Brockington
Pingback: MDPI Experience Survey Results | Dan Brockington
Thanks for this deep dive into the nuances of MDPI. I had never heard of them until I received an offer to be a Guest Editor of a Special Issue today. Of course, never having heard of them, my guard was up. This review has helped me put things into better perspective. Thank you
Delighted this useful. Thanks for looking at it.
Thanks for the commentary! I am increasingly interested in how others view MDPI, and how MDPI promotes itself. Especially interesting to learn that MDPI rejection rates are… very high! Though given their commentary to Paolo’s article, they made it sound like they renew submissions as novel rather than consider them as the same submission? If I understood correctly, that might suggest that many of their rejected articles are ultimately published in MDPI anyways? Do you know anything about what their rejection rates mean?
I am also curious if you’ve looked at the self-citation rates of MDPI journals (themselves and to each other)? This was highlighted in a recent article on MDPI as a potential predatory publisher (now with attached Expression of Concern by the publisher “Research Evaluation”), but the claim that MDPI has a very high rate of internal citations seems robust. MDPI itself added a commentary on this article, and included their own plot of self-citation practices by publishers (here: https://www.mdpi.com/about/announcements/2979). But… they did not seem to directly dispute how they are extreme outliers to the linear regression of mega publishers going up and to the right in Fig 1, nor how they are amongst the highest self-citers in smaller publisher groups. Their response was a pretty weak: “It can be seen that MDPI is in-line with other publishers, and that its self-citation index is lower than that of many others; on the other hand, its self-citation index is higher than some others.” – to me it looks like they’re probably in the top 5-10 percentile for self-citing.
I am wondering how much of MDPI’s success is a snowball effect? Do a small clique of authors find it easy to publish in MDPI, and they are also extreme self-citers? Do MDPI journal editors insert themselves as reviewers and reinforce self-citing? Given the diversity of journals, I don’t think niche interest can explain self-citation rates…
Pingback: The insidious corruption of open access publishers | Igor Pak's blog
actually maybe don’t publish this comment, it might have provided too many specifics which might not be good (e.g. name of journal and description of paper)
Yes makes sense not too for that reason
Pingback: MDPI Journals: 2015 -2021 | Dan Brockington
Pingback: Bulletin d'information sur l'édition scientifique Numéro 10 - RNBM