
(For a PDF version of this blog and the data used to produce it please go to the end of this blog)
In this blog I report on growth of MDPI journals and papers from 2015-2021. It updates previous blogs on the same topic (the most recent is here) that looked at growth up to 2020. The issues which make MDPI’s work interesting are now well discussed those blogs, and in Paolo Crosetto’s analysis. I have therefore not provided a detailed commentary on the most recent findings, rather I wish briefly to highlight two developments that are clear in the 2021 data. These are that growth continues and that low rejection rates are lower than they were previously.
The methods I have used to compile these data are described at the end of this document. The data I have used are also available there. The data available consist of 206 of MDPI’s 378 journals, producing over 233,000 publications in 2021, which is a substantial majority of the 235,600 peer-reviewed papers published in that year. However data on submissions and acceptance rates are no longer available on the MDPI journals website (as of June 2022). It will therefore not be possible to provide further updates.
1. Growth
By every measure MDPI’s growth continues to be remarkable. The rate of revenue increase has slowed in the last two years, to just over 50%, but even that remains extraordinary. Note that the proportion of submissions that are published has increased, from around 44% two years ago to over 55% currently (Table 1; Figure 1).
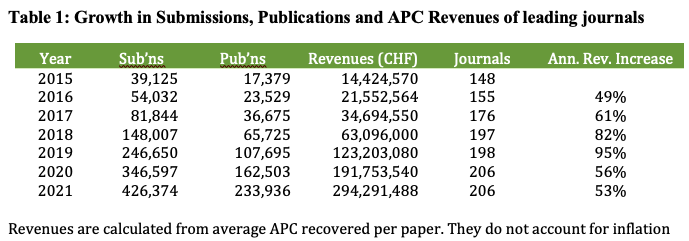
Figure 1

Growth continues in other ways too. In 2021 MDPI launched 84 new journals (!) and acquired two more existing journal titles. There were 378 listed titles in June 2022. There is also growth in formal recognition, with 85 journals now listed with Impact Factors in the Web of Science, up from 80 in the previous year.
2. Rejection Rates Are Lower
The growth in publications is partly sustained by lower rejection rates. The journals with the lowest rejection rates used to count for only a minority of publications and fees (Tables 2-4). Now figures for 2021 show that journals with low rejection rates are producing a higher proportion of MDPI publications. This fact is important because I have questioned claims that MDPI is a form of predatory or vanity publishing because the rejection rates of its journals were too high. Researchers were not simply paying for publication, because, in previous years, more material was rejected than was accepted.
Now, some 45% of the MDPI journals I analysed, have rejection rates of below 40% (Table 2). Papers in these journals account for nearly 38% of revenues from publication fees (Table 3). Conversely, the journals with rejection rates of over 50% account for just over 25% of revenues. Measures of esteem, such as listing in the Web of Science, did not seem to make a difference to rejection rates. Average rejection rate for WoS listed journals was 42.7%, and for unlisted journals 41.6%.

The changing importance of low rejection rate journals for revenues is illustrated in Figure 2. These graphs show journals in rank order of their rejection rate (lowest first) and shows how revenues from publishing fees increase as each journal is added. It presents figures in absolute numbers (the first graph), and as a proportion of all publishing revenues in this data set (the second). The latter brings out most clearly the financial impact of the low rejection rates.

It is important to put this shift in perspective. MDPI has always maintained that it will encourage publication of papers whose findings are true, regardless of their significance or scope. I discussed this issue in my first blog on this topic (see point 4). Significance and scope are to be determined by the reading community after a paper is published, not by the reviewers and editors beforehand.
However the corollary of this approach, given the growth in publications, is that it is more likely that these journals are now publishing papers that will be deemed insignificant by the research community. It will become harder to find really good and important papers in all the volume of material generated. This problem is compounded by the fast turn-around times of papers (a median of 38 days from submission to publication in 2021) because the speed increases the risk that mistakes are made in the review and revision process.
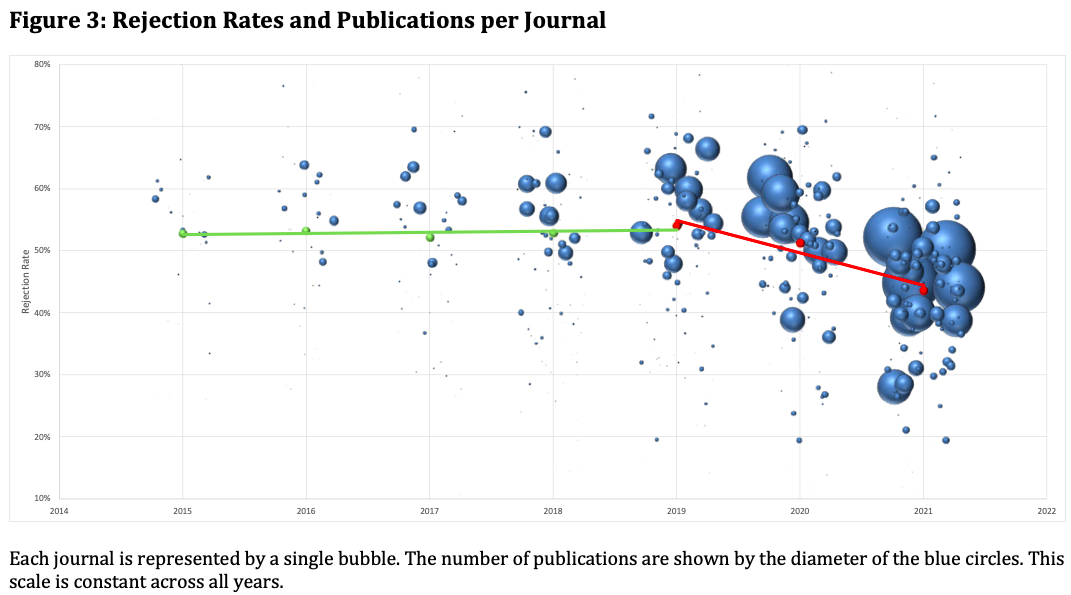
MDPI itself has been aware of the dangers of being too inclusive. In its 2015 annual report it noted that the overall rejection rate had increased since last year (from 52 to 54%). This achievement was listed in one of the key performance indicators as a sign of progress. MDPI’s shifting stance can be best seen in Figure 3. From 2015 through to 2019 the number of publications grew, generally keeping within a rejection rate range of 50-70%. The average rejection rate, weighted by journal output, is shown by the green line. Indeed in 2019 more papers appeared in journals with rejection rates over 60% than previously. However from 2019 onwards the weighted average has declined (shown in the red line).
Nevertheless, I would not conclude from these changes that MDPI is now a predatory press. I think it is rarely helpful to use categories of journals such as ‘predatory’ or ‘not predatory’ in the current publishing ecosystem. All major publishing houses profit from free researcher labour. Some exploit individual academics and their research funds through charging licencing fees, others raise revenues from libraries and subscription charges, and others make deals with governments to cover entire University sectors. Some combine all these methods. In the process each publishing house presents a range of behaviours on dimensions such as transparency, profitability, exclusivity, giving back, citation and self-citation, respectability and so on. MDPI is shifting within these dimensions; it has not changed category. Using categories to explain these dynamics will not help us understand the problems of academic publishing.
We can predict that if this pattern is sustained it could affect MDPI’s brand and reputation. This could happen if researchers find too many weak or insignificant papers in the journals they are consulting. Or it could happen if it becomes widely known that a journal is relatively easy to publish in. This would reduce the kudos of having a paper accepted.
However, because acceptance and rejection data are no longer available on the MDPI website, we will not know what is happening to rejection rates. We cannot know, at the level of each journal, how inclusive they are, or are becoming. This points to a wider need for all publishing houses to be more transparent with the data of their journals to allow researchers to make informed choices about their journals. MDPI’s transparency had been welcome. It is now, unfortunately, following the standards set by the other publishing houses.
Dan Brockington,
Dar es Salaam,
10th November 2022.
Methods
In June 2016 I copied data for submissions and publications for 206 journals that were available on the MDPI website that began in or before 2015. At that time MDPI made publication data available for four previous years, and only when four years of data were available. Data I used in my analysis are available here.
Average net APC are based on figures provided by MDPI that have been put in the public domain. They are lower than APC charged because they are net of all waivers exercised. None of the figures presented above account for the effects of inflation.
A PDF of this blog is available here.

Pingback: MDPI Journals: 2015-2020 | Dan Brockington
Thanks for this
I was wondering whether it would not be fruitful to study the average number of references cited (nb) in year n by a journal, and the (%) of these references that are from years (n-1) and (n-2), therefore ‘counting’ for the IF. By plotting nb and % for a large number of journals you might be able to isolate statistically those which, through citations rings and the like, maximize %. Mapping the journals that are cited would also provide insight on journal coalitions that cross-reference each other (it is no longer MDPI citing only MDPI, although still quite high a rate, since the business has expanded…). (This indicator would add to the self-citation indicator.)
If you find that % is around, say, 10% in non predatory journals, but around 25%, in MDPI et al. then you get a measure of the efforts deployed to game the system…
Pingback: MDPI Journals: 2015-2018 | Dan Brockington
Pingback: MDPI Journals: 2015 to 2019 | Dan Brockington